17 Assessment of Segregation
17.1 Why it matters
Walkability is strongly correlated to health, and many studies have found that populations in more walkable areas are less likely to be obese (Riggs 2016) and perform better on many other health indicators as well (Su et al. 2017). Built environments and the design of neighbourhoods can influence residential behaviours and health consequences, according to accumulating research, with data indicating that these communities not only have lower rates of obesity and overweight people but greater active physical activity engagement as well.
When auditing any environment for walkability, therefore, it can be helpful to understand the following:
- Who are the more vulnerable or advantaged populations?
- Where are they located?
- What factors about their built environment and streets make them more vulnerable?
Answering these questions will help identify how we can improve an area to ensure an equitable allocation of resources.
17.2 Ways of Identifying Segregation
Segregation can occur at various resolutions. The first obvious way to get an overview at a city level is through ward or constituency-level data, which is often easily available. For example, in the case of Bangalore, we can use 2011 census data to find where there are higher percentages of people belonging to scheduled caste/scheduled tribe (SC/ST):

Concentration of SC/ST Population in Bangalore’s Wards
The obvious
Caste is still the most significant factor in urban residential segregation in India, significantly higher than the level of socioeconomic segregation (Vithayathil and Singh 2012) and has a significant impact on social cohesion and equal access to opportunities, as lower-caste individuals often face barriers to accessing amenities, and other resources due to their residential location. It is hard to spatialize this data in a definite way, but one way to look for it is by observing the presence of organizations associated with lower-caste communities. This can be done by collecting data on the location of organizations such as Dalit welfare associations, Ambedkarite organizations, and other social and political groups representing lower-caste communities, and plotting them on a map.
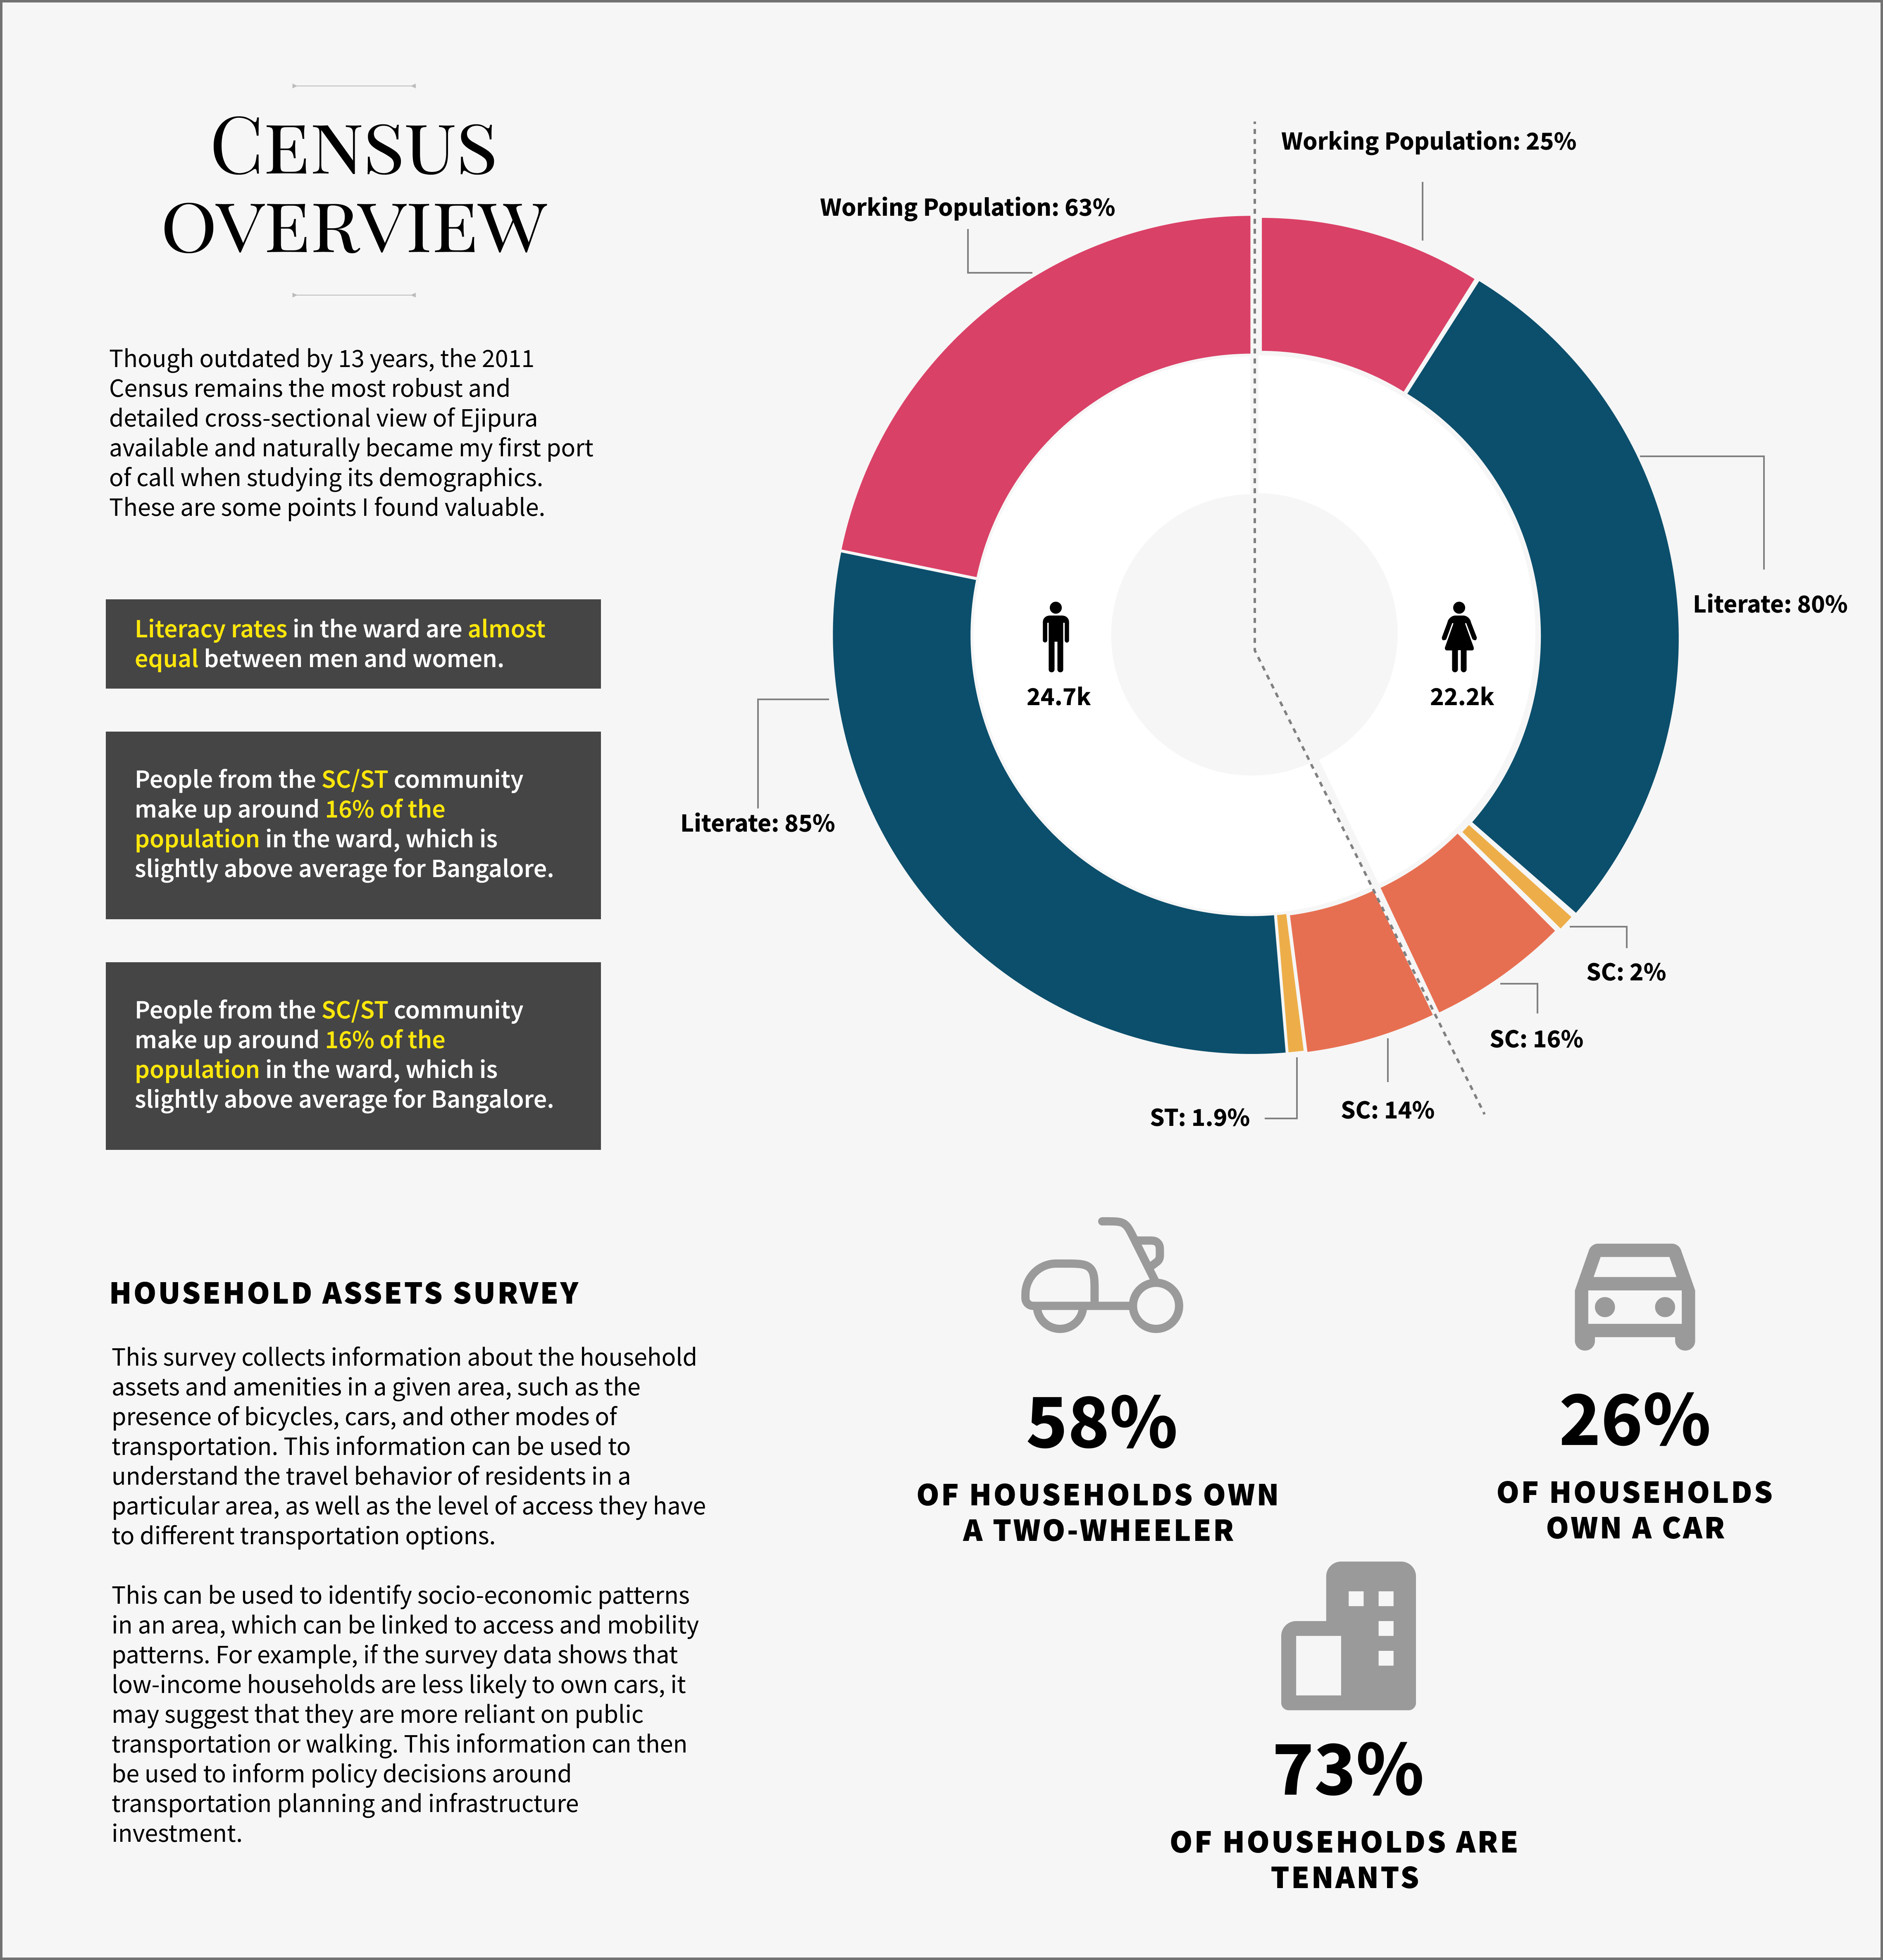
Example of insights from census data
The less obvious
Aside from the obvious stratification based on caste, what other ways can your study area be divided? Even in a seemingly homogenous area, various factors can influence who lives where. For example, the area could be divided between:
Native residents and migrants.
Working population by type of work, such as those working in the service industry vs those working in the informal sector.
Language: Based on the language spoken by the residents, such as those who speak the local language versus those who speak a different language.
Housing tenure: Segregating an area by housing tenure, such as those who rent vs those who own their homes, could reveal disparities in wealth and access to affordable housing.
In Ejipura, we were able to identify some micro-neighbourhoods this way. For example, it is a home to many people from the north-east region. We identified the region where the this population was concentrated by observing the kind of shops and restaurants in some areas:
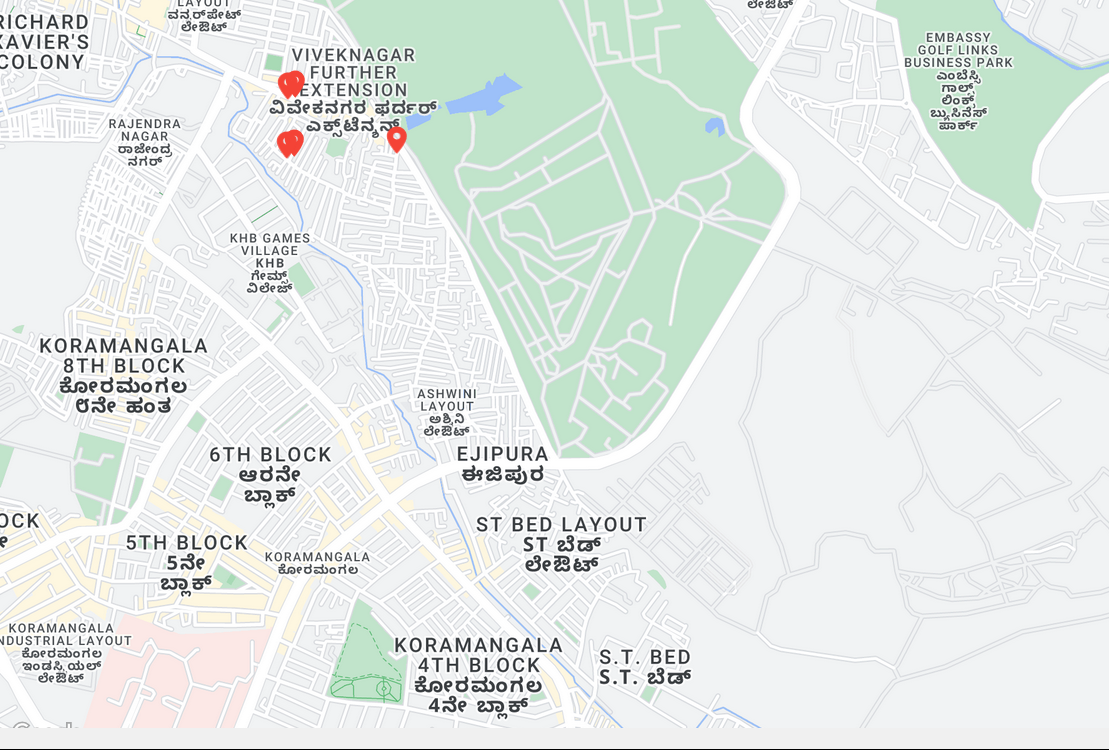
North-eastern shops in Ejipura
Similarly, paying guest accomodations and apartments that are generally for short-term rental for students and working class people are concentrated in another area:
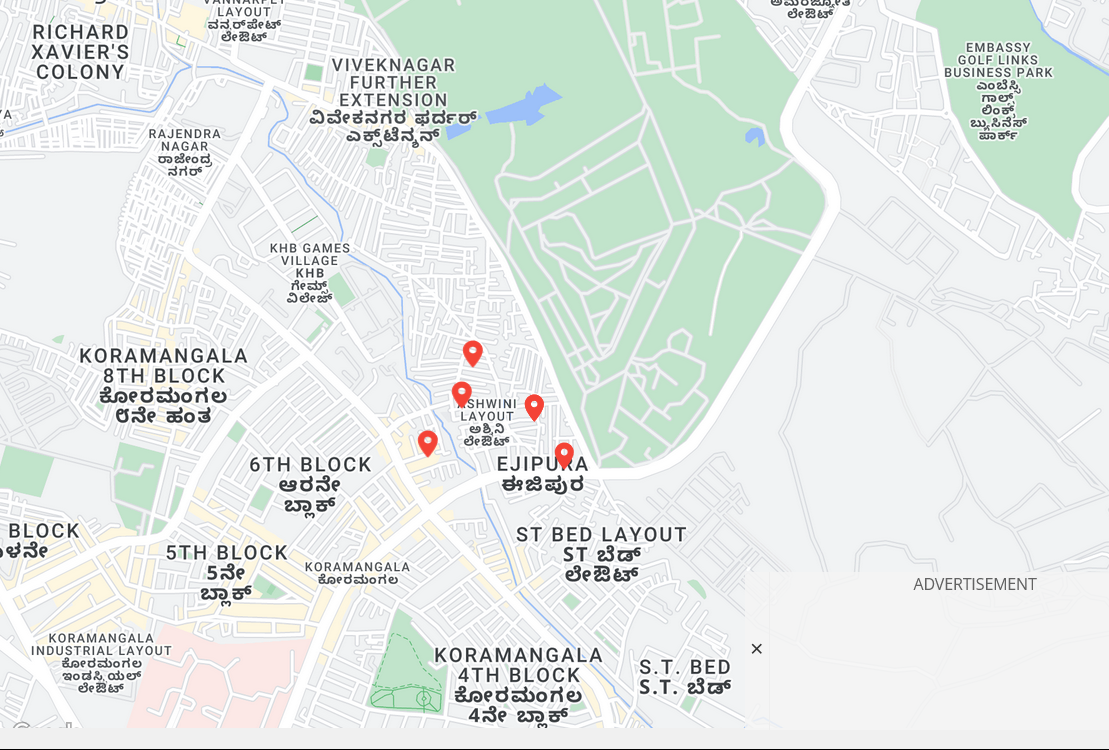
PGs in Ejipura
Economic
Unfortunately, there is no comprehensive source of data that helps us spatially visualize economic segregation. Even the general census does not include questions on consumption levels or economic condition of households.
However, you can construct a broad map of income levels based on visual observation of streets and buildings as well. For example, in Ejipura, we used observational and anecdotal evidence to divide the area into three income groups. This was based on the type of housing, condition of streets, and interviews with residents.
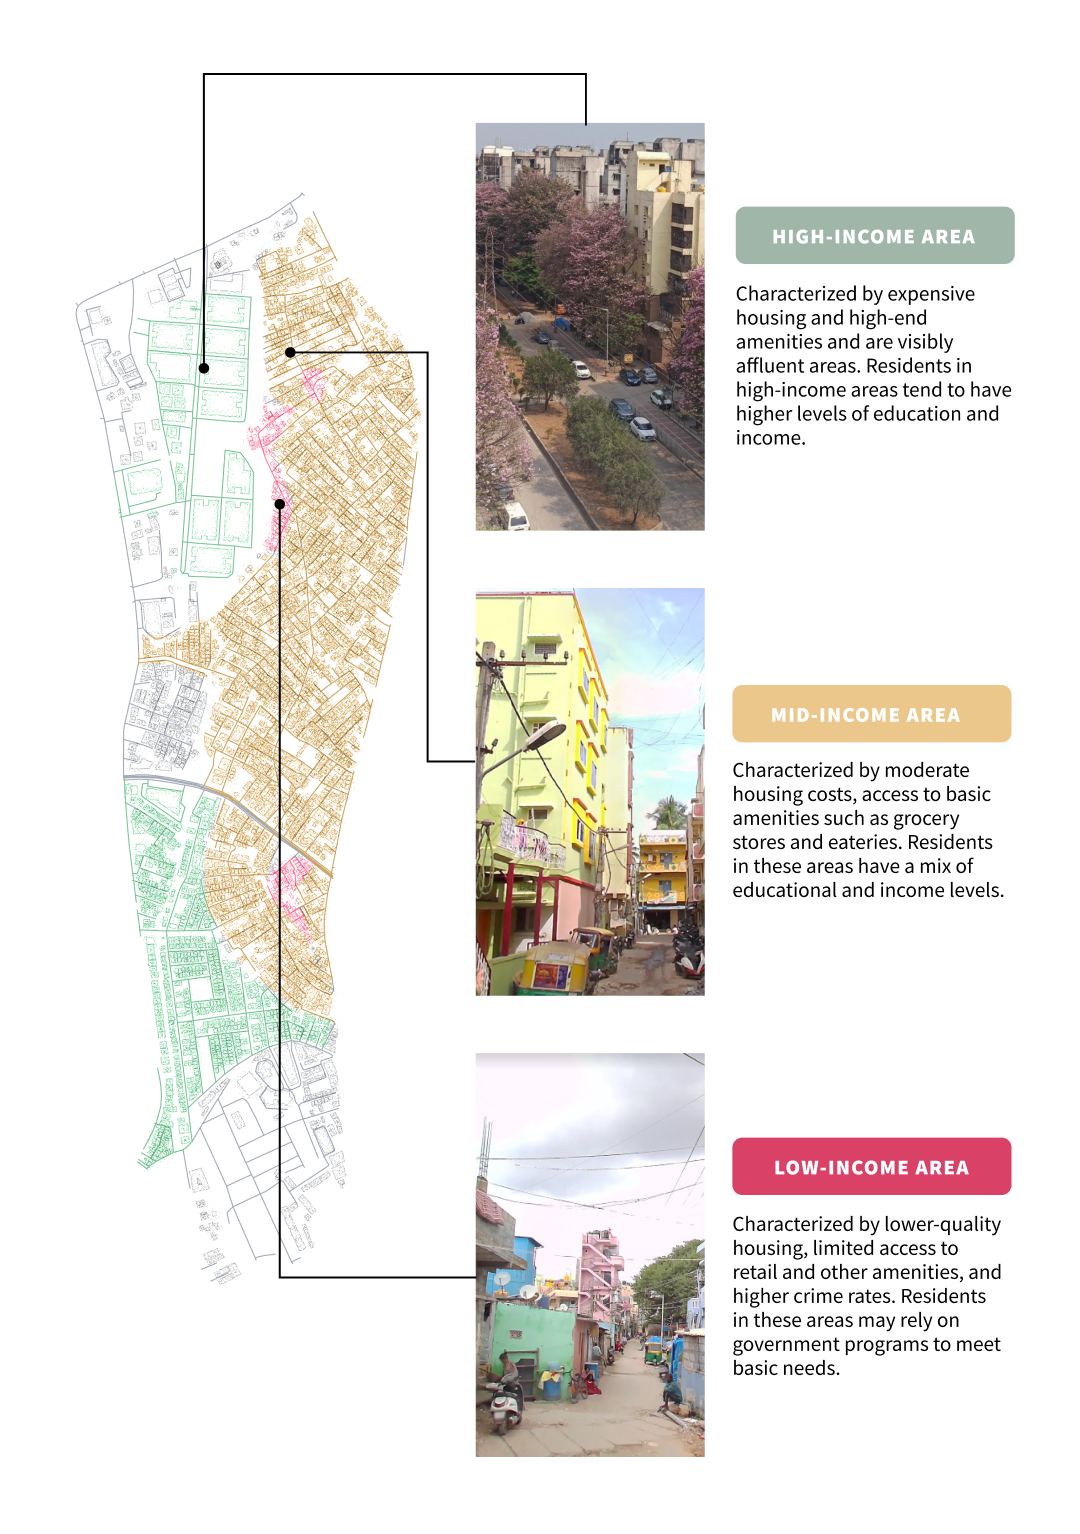
Identifying income levels through visual observation
These are subjective observations by their very nature but some of the things you can look for, in addition to the above, are:
Housing type and condition: Look at the type and condition of housing in a given area. Low-income areas may have more rental housing and consist of smaller units. Mid-income regions may have a mix of rental and owner-occupied housing, while high-income areas may have larger, more expensive homes in better condition.
Transportation options: Look at the transportation options available in a given area. Low-income areas may have limited access to public transportation and poorer pedestrian infrastructure. In contrast, high-income regions may have more options for alternative transportation and better-maintained roads and sidewalks.
Public spaces and amenities: Look at the quality and availability of public spaces and amenities in a given area. Low-income areas may have fewer parks and open spaces, while high-income regions may have more resources and better-maintained public spaces.
Such characteristics should be always be considered alongside other variables from census data and income surveys if available, since they are not always reliable markers of income levels. If you’re able to get your hands on enumerator block level census data, which is the smallest unit of census data available, it can help inform these decisions better. Unfortunately, the process of getting access to this data is complicated and very restrictive (as shown on the website for IIM Bangalore).
Spatial
The built environment, through the design of streets and the connectivity between them, can also reflect the extent of segregation in an area (Vlachou and Vaughan 2015). This isn’t to say that the design is intentionally exclusionary, but the inherent properties of the space may contribute to the exclusion of certain groups. The environment can influence the politics that govern it. Therefore, to fully understand how specific groups may be excluded, we need to consider the background and social context surrounding it (Winner 1980).
It is possible to map the spatial properties of your study area through spatial syntax analysis (SSA), a quantitative method to understand the configuration of a built environment and reveal how it is potentially used by pedestrians and motorists (Dettlaff, n.d.). The methodology is highly technical and includes many parameters we can analyse for our area, but we need to concern ourselves with only one metric; angular step depth.
In simple terms, angular step depth measures how near or accessible areas within the street network are. Well-connected streets with high intersection density allow you to walk from one place to another in lesser time. While this may seem obvious, as the farther you go, the less accessible an area is, the benefit of this analysis is evident when we analyse an area like Ejipura:
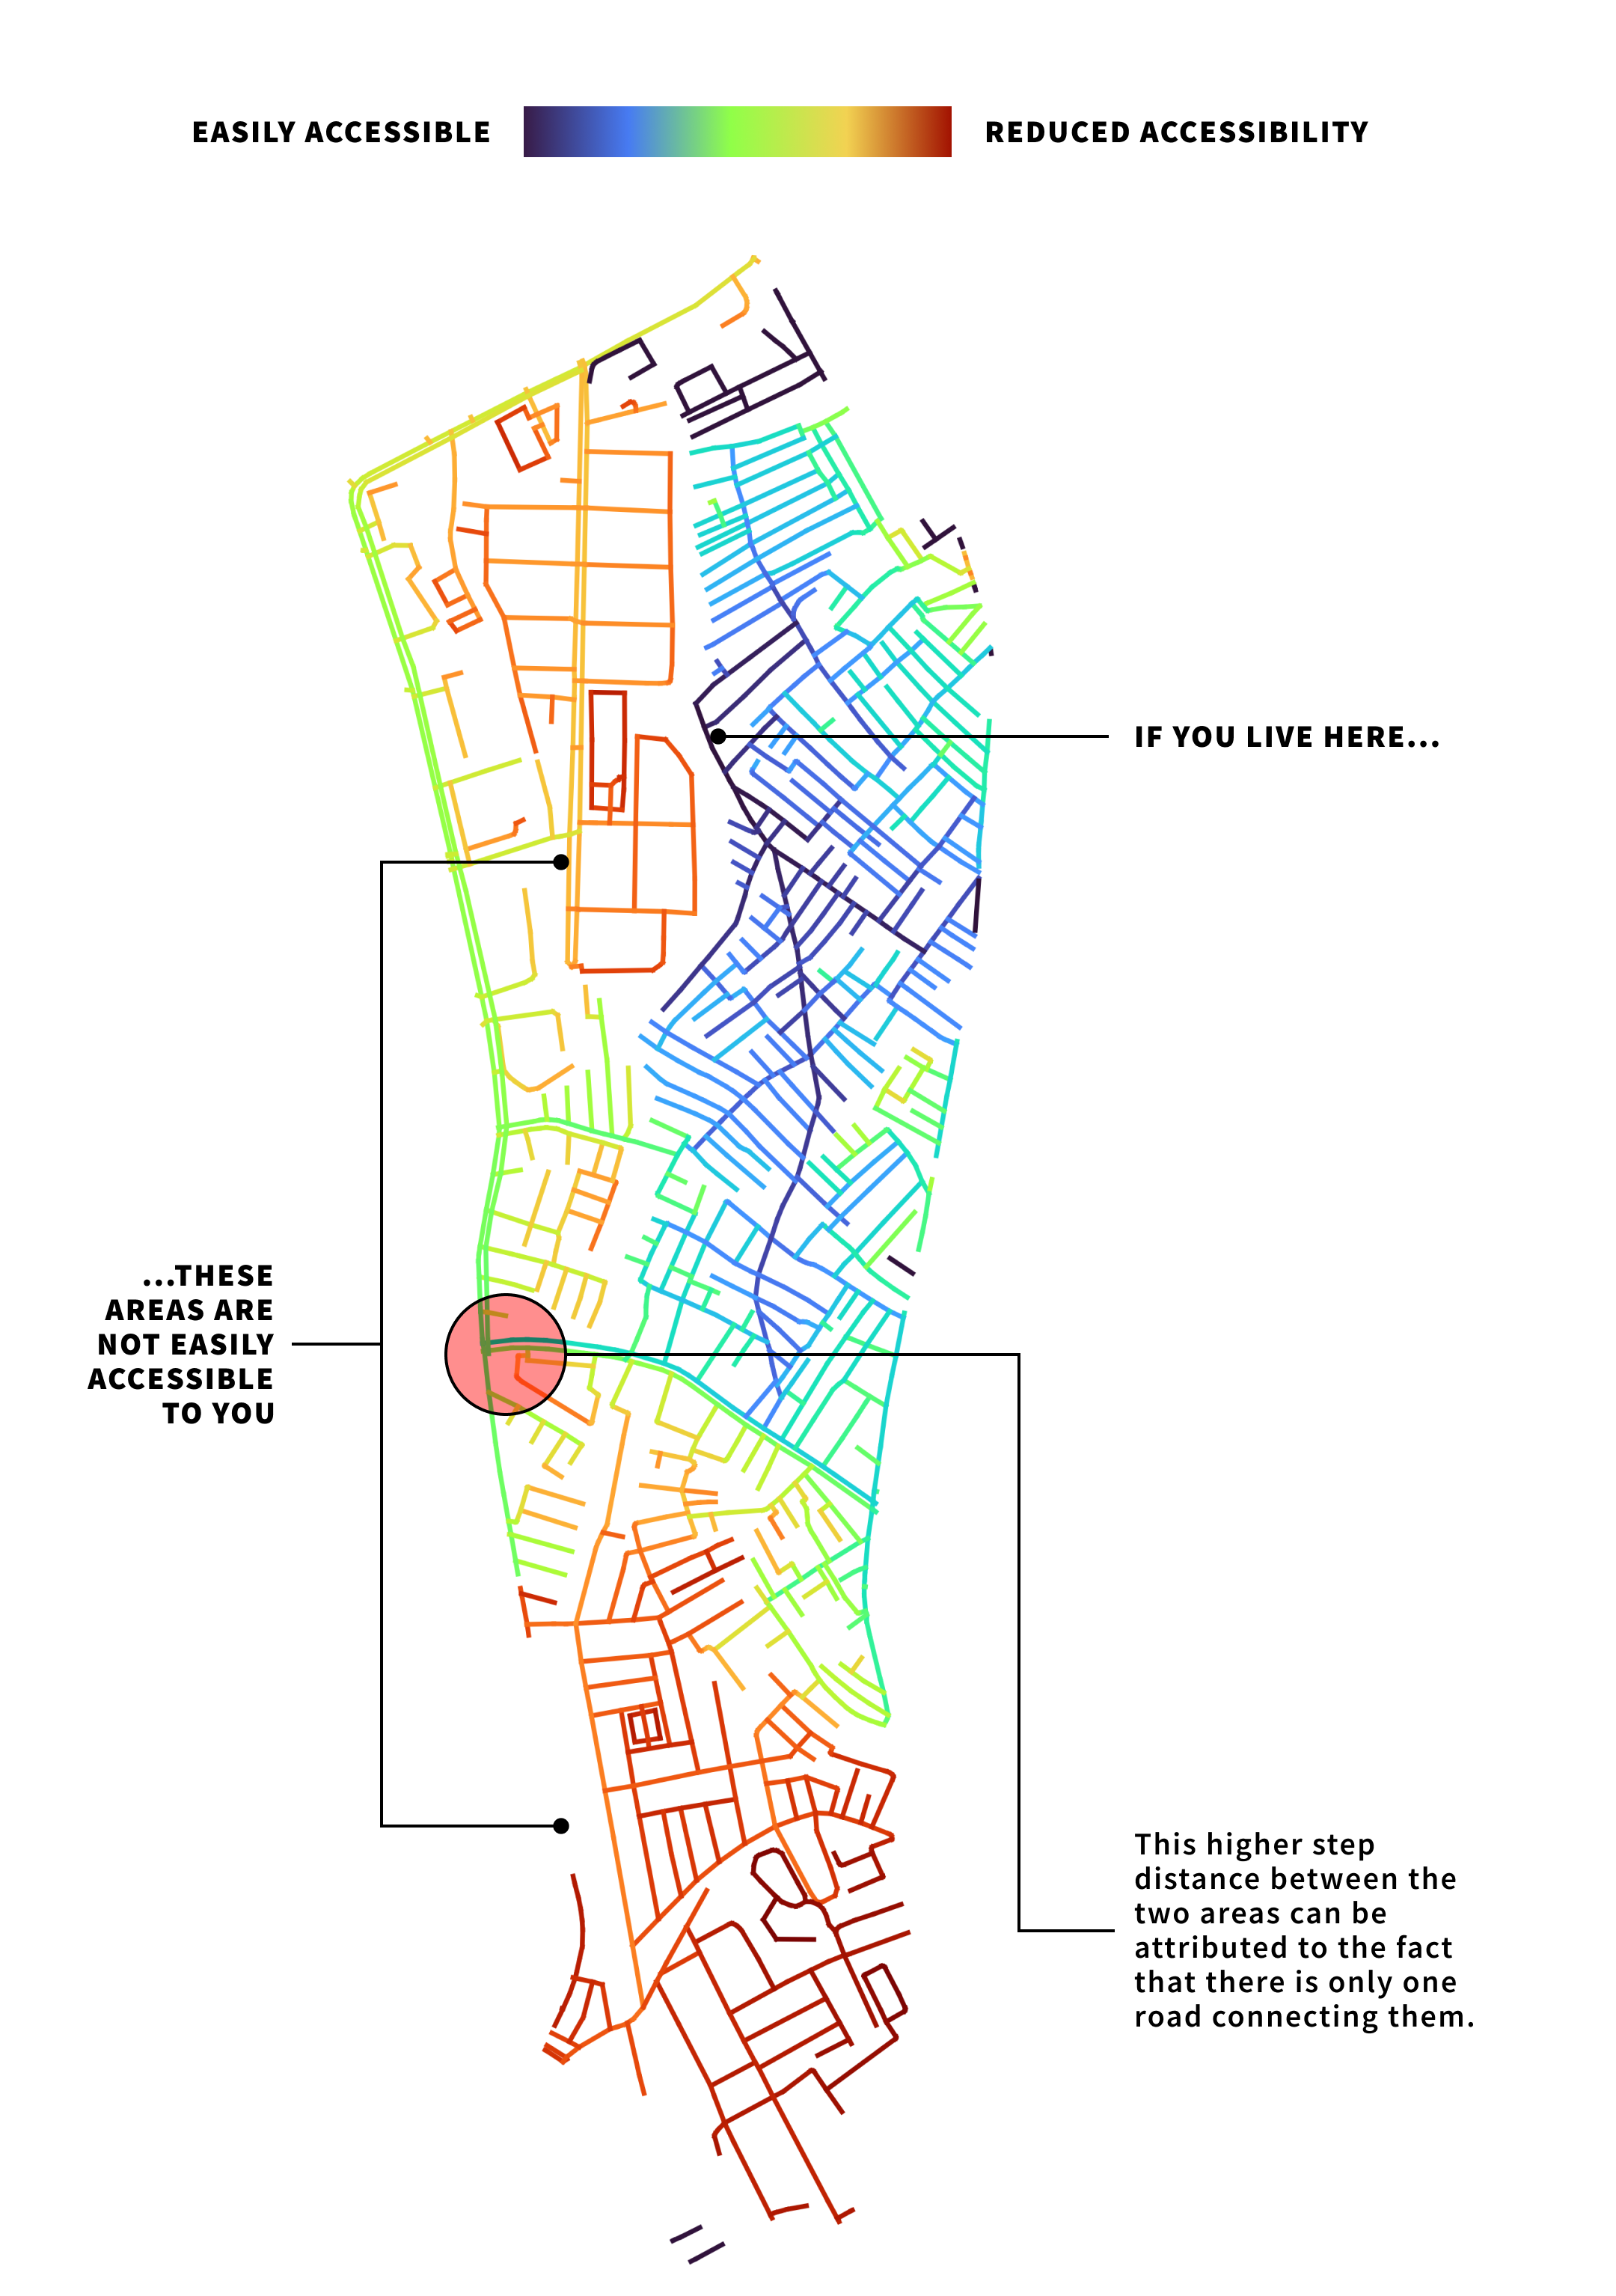
Angular step depth map starting from inner Ejipura
Here, because of the design of the network, the National Games Village is just as inaccessible for people living in the blue region as the southern tip of the ward, despite being adjacent to each other. The reduced accessibility, whether by design or not, makes the two areas spatially segregated. This understanding, layered with observations on the built environment ?? and through secondary research methods, can provide a valuable starting point for identifying general levels of segregation within an area.
Social